Get Indexology® Blog updates via email.

In This List

Too High or Too Low? Look at Tobin’s Q

Recent Changes in India – Impetus for ETF Growth?

To perform or not to perform…that is the question for the Indian PSU ?

Jaw-Boning at the Fed

Holding Bonds As Rates Rise

Too High or Too Low? Look at Tobin’s Q

Contributor Image
David Blitzer

Former Managing Director and Chairman of the Index Committee

S&P Dow Jones Indices

August was not the best of months in the stock market: the S&P 500 lost 3.1% and the Dow lost 4.4%.  This leaves investors wondering what’s next?

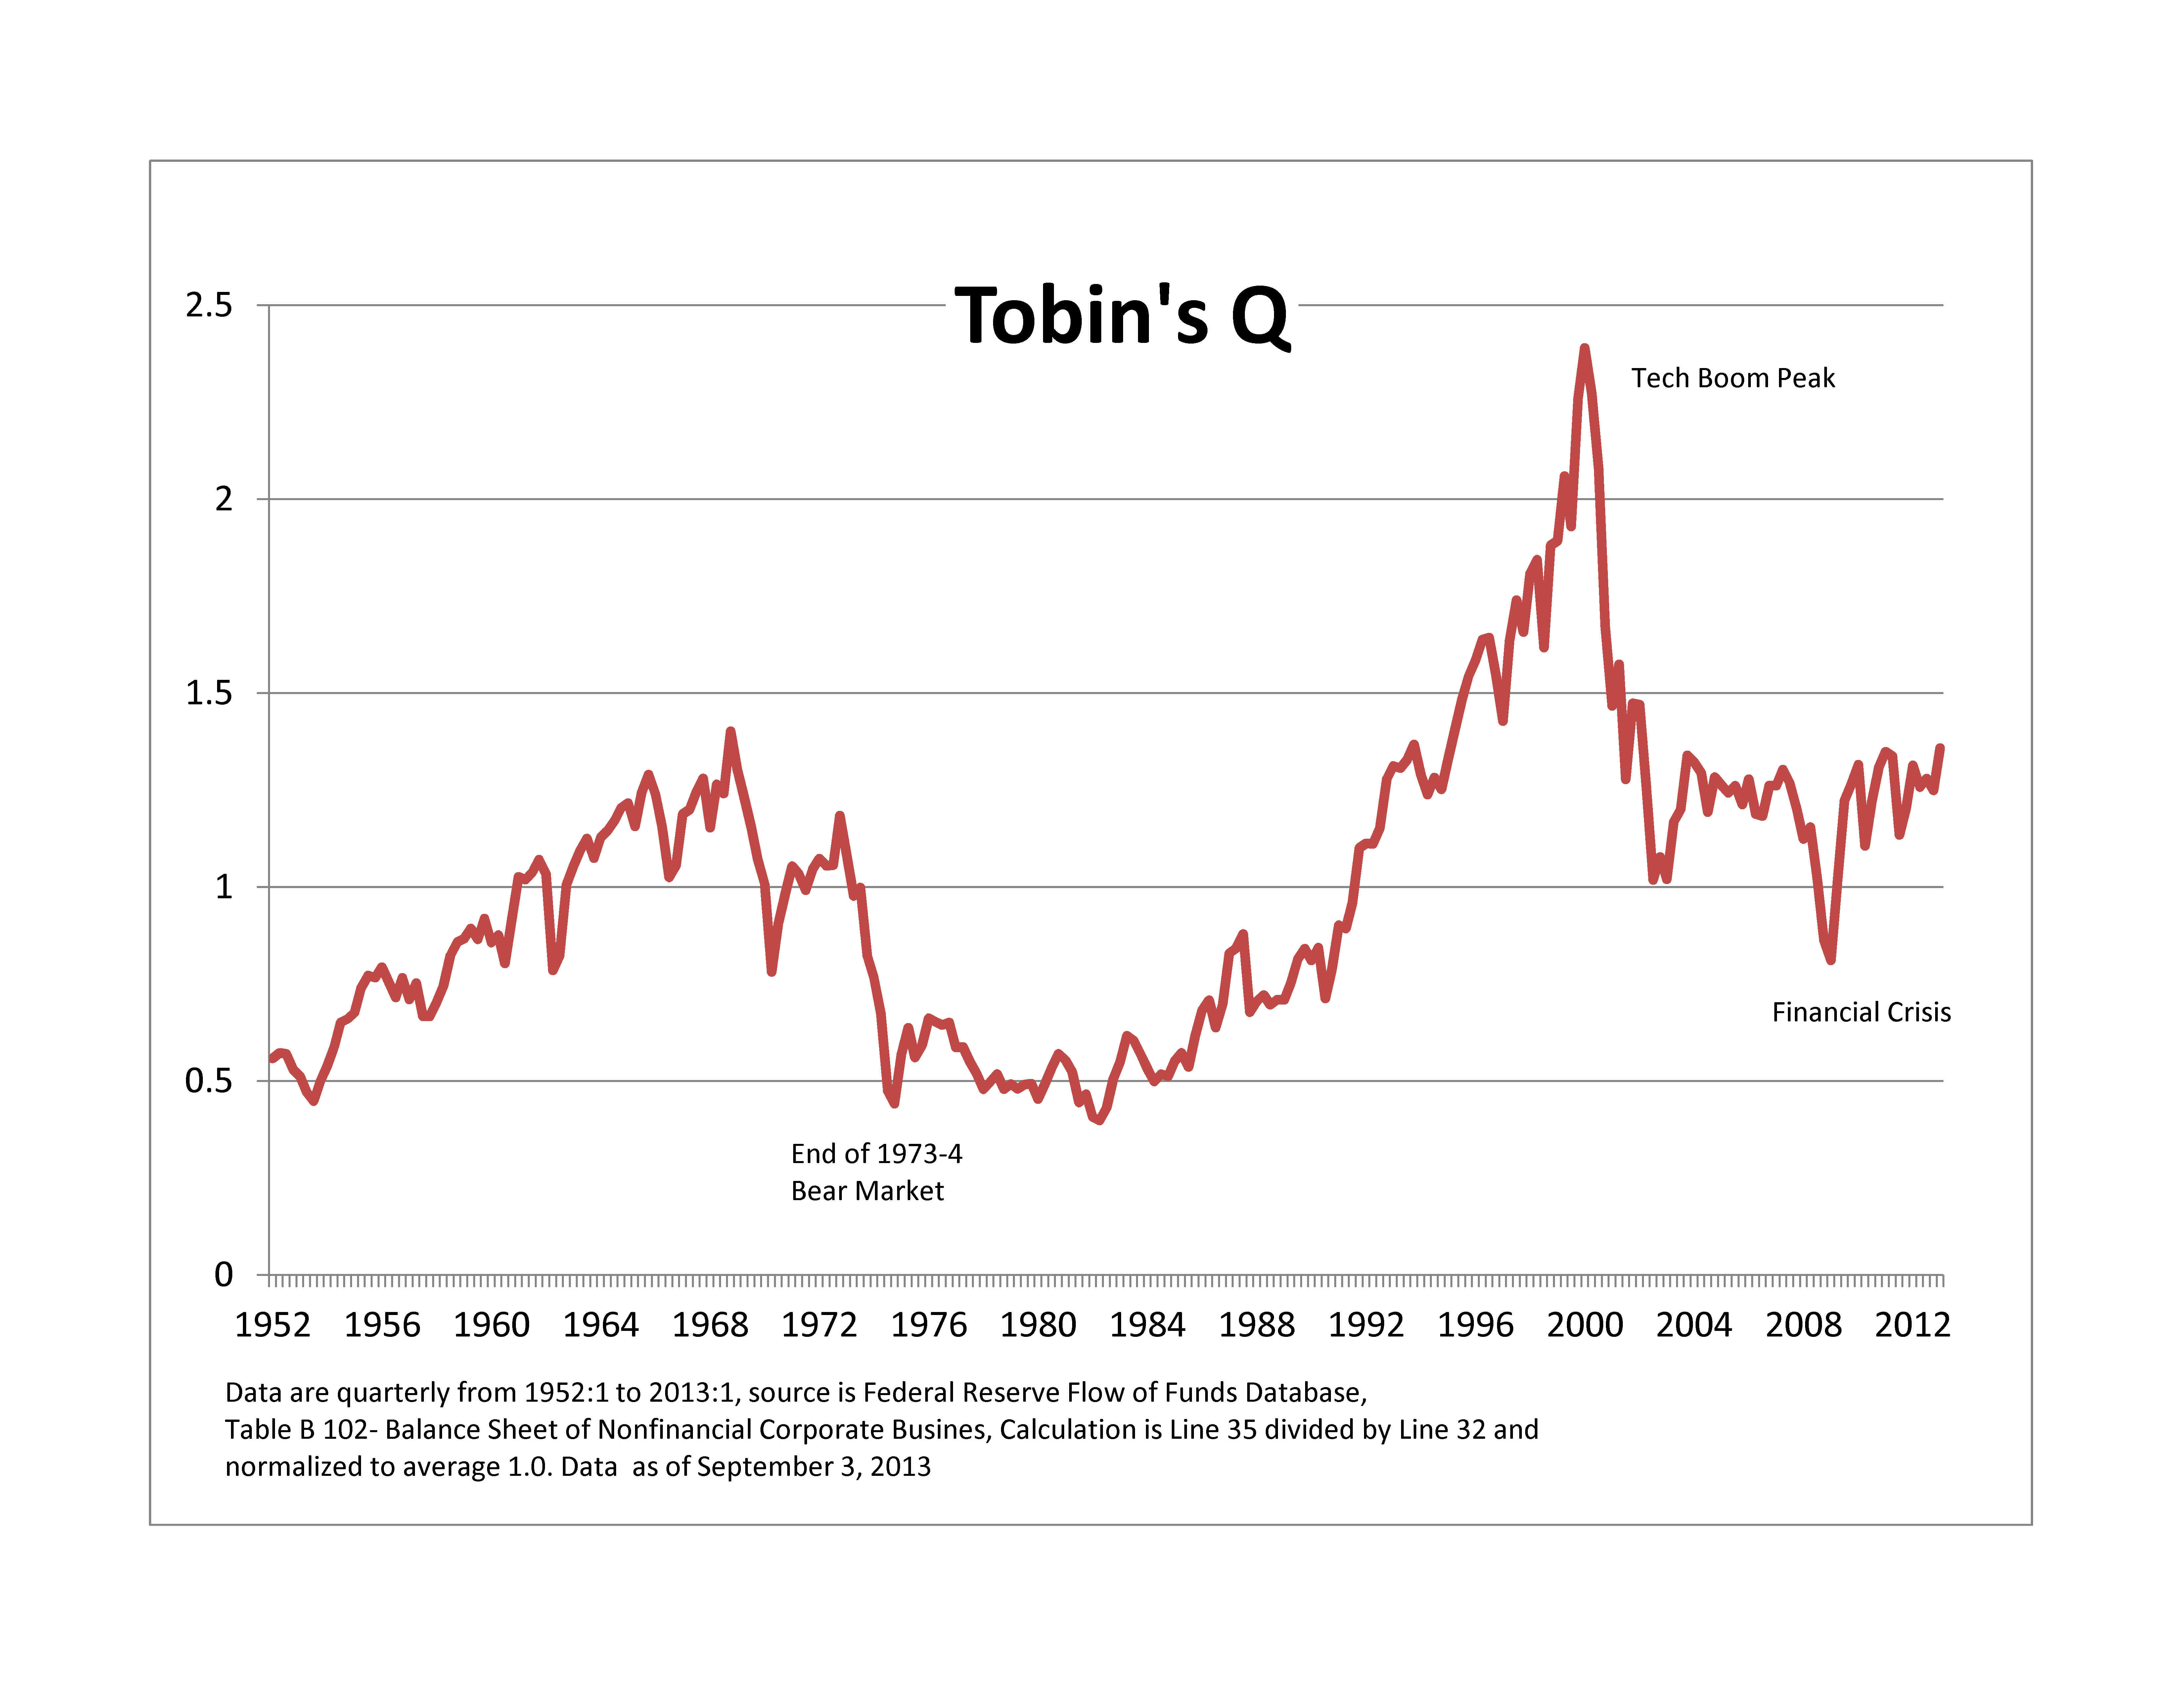
The stock market bounces up and down more often with more amplitude and less method to its madness than the rest of the economy.   If one could get past the noise in the market, there should be a financial measure of the economy’s value – an indicator that based on the financial data of the stock market and the value of the economy.  Tobin’s Q does this; it is the ratio of the market value of stocks to the replacement cost of their assets.  It was developed by James Tobin, a Nobel laureate economist some 25 years ago.  If one could buy all the assets of all the companies in the market for less than the market value of those companies, the companies would be over-valued and Tobin’s Q would be greater than one.  If the reverse – the cost of buying the assets of all the companies is greater than the market value – is the case, the market is under-valued.  From time to time, the stock market value of an oil company seems to lose any connection to the value of the company’s oil reserves.  If an oil company’s reserves are worth $30 billion while its market value is $10 billion, some analyst will suggest “drilling for oil on Wall Street” and Tobin’s Q for the company, assuming the only asset were the reserves,  would be one-third.

We can calculate Tobin’s Q for nonfinancial corporations in the US using data from the Federal Reserve’s Flow of Funds (FOF) database.   The FOF includes a consolidated balance sheet which shows both historic and replacement cost series and the market value of equities.  While the average level of Q over a very long time period should be one if the data are comprehensive, the average from 1952 to the first quarter of 2013 is a bit less at 0.74.

To make the chart easier to interpret, the series is normalized to average one over the entire time period.  The chart shows the three times since the 1950s when the S&P 500 lost about half of its value – 1973-4 Bear market, the aftermath of the Tech Boom and the financial crisis. Tobin’s Q warned about each of those.  As of the first quarter of this year, Q was moving higher. It is nowhere near as high as it was when the Tech stocks peaked, but it is back at levels seen before the financial crisis.

tobins q

Tobin’s Q is not the only market signal attracting attention.  The Financial Times wrote a long piece about CAPE – the cyclically adjusted P/E ratio developed by Robert Shiller, one of the developers of the S&P/Case-Shiller Home Price Indices. As the FT notes, there is a lot of debate about what CAPE is signaling. The paper also compares CAPE and Q.

The posts on this blog are opinions, not advice. Please read our Disclaimers.

Recent Changes in India – Impetus for ETF Growth?

Contributor Image
Anubhav Srivastava

Head - Product Development

Motilal Oswal Asset Management

Since its inception a decade ago, ETFs’ in India have clocked significant growth. The number of ETFs’ and ETP listed has grown to 37 and are spread across Gold and Equity with a single money market ETF. While the assets are currently at $2bn, there are changes afoot which will see the ETF business undergo an important transformation over the next few years. A noteworthy change was the reduction in the Securities Transaction Tax (STT) for designated equity investments from 10 bps to 1 bp which reduced creation/ redemption/ trading costs and resulted in narrower spreads.

Retail Investment
In the past few years, Reserve Bank of India* and the SEBI*, have taken an initiative to promulgate an RDR-style regulation along with the advent of a commission free – direct share class (known as a ‘direct plan’). The regulation (SEBI Advisor Regulation) mandates registration of all intermediaries as either distributors (where they get paid by the manufacturer for distribution) or advisors (paid by clients for advice). For such advisors, ETFs’ make ideal building blocks for designing and managing investment pools including optimized asset allocation strategies to more sophisticated target date portfolios. The low cost ensures the returns are better and the transparency improves ex-ante risk management. An ETF based portfolio, therefore, becomes an attractive option for advisors who wish to efficiently manage client portfolios and charge an advisory fee (to offset revenue shortfall as a result of said advisory regulation).
Additionally, the government has introduced ISA (UK) /401K (US) type tax incentives which give retail investors a tax break on ETF investments. While the scheme is clearly targeted at attracting long term money to equity markets, it has the potential to introduce a hereto untapped segment.

Institutional Market Developments
At the moment, all insurance and pension funds are managed in house and list of eligible securities is small. For all such funds, additional restrictions apply including limiting 1.5% of the portfolio for mutual fund investments (including ETF) and a prohibition on investing in parent company shares. This prevents fund managers access to inexpensive beta exposures and even manager selection. Proposed changes to the Insurance and Pension Fund (and Mutual Fund regulations) regulation envisages allowing all three categories to invest into ETFs’. This would open up a $400 bn growing market for ETF manufacturers. While domestic ETF cater to the demand for wider market exposure and as elements in quantitative strategies, foreign ETFs’ will be required to diversify portfolios.

Given these changes and the launch of the government promoted Central Public Sector Enterprise (CPSE) ETF one can expect to see a proliferation of both domestic and foreign ETFs’.

*Note:
Reserve Bank of India regulates the bond and money markets (and consequently, banks)
Securities and Exchanges Board of India regulates the capital markets
Insurance Regulatory and Development Authority regulates Insurance Companies and Funds
Pension Fund Regulatory and Development Authority regulates all government and private pension funds
Forward Markets Commission regulates all commodity markets

S&P Dow Jones Indices is an independent third party provider of investable indices.  We do not sponsor, endorse, sell or promote any investment fund or other vehicle that is offered by third parties. The views and opinions of any third party contributor are his/her own and may not necessarily represent the views or opinions of S&P Dow Jones Indices or any of its affiliates.

The posts on this blog are opinions, not advice. Please read our Disclaimers.

To perform or not to perform…that is the question for the Indian PSU ?

Contributor Image
Utkarsh Agrawal

Associate Director, Global Research & Design

S&P Dow Jones Indices

The notion of an investment in equity of a public sector undertaking may appear to be a very stable investment with long term growth opportunity especially in developing countries like India. However if we explore the performance of the S&P BSE PSU with S&P BSE SENSEX in a five year horizon, the picture turns out to be a little different. S&P BSE PSU represents approximately 20% by full market capitalization of S&P BSE 500.
As on July 31, 2013 there is a huge gap between the year to date cumulative returns given by S&P BSE SENSEX (-0.42%) and S&P BSE PSU (-25.70%). On analyzing the returns for a five year period, S&P BSE SENSEX has given an annualized return of 6.15% whereas S&P BSE PSU has given -4.06%. The risk percentage per annum has also remained low in S&P BSE SENSEX as compared to S&P BSE PSU. Table 1 below summarizes the statistics of both the indices for a period of five year ending July 31, 2013.

Performance of India PSU_Graph_Utkarsh

S&P BSE SENSEX also consists of six PSU stocks out of which five have given negative annualized returns as on July 31, 2013.
Based on the above, we can conclude that most of the PSU’s have not been able to outperform the market.
Performance of India PSU_Graph_Utkarsh1

Source: S&P Dow Jones Indices and BSE Ltd. Data from July 31, 2008 to July 31, 2013. Index performance is based on price return index levels in INR. Past performance is not an indication of future results.

S&P Dow Jones Indices is an independent third party provider of investable indices.  We do not sponsor, endorse, sell or promote any investment fund or other vehicle that is offered by third parties. The views and opinions of any third party contributor are his/her own and may not necessarily represent the views or opinions of S&P Dow Jones Indices or any of its affiliates.

The posts on this blog are opinions, not advice. Please read our Disclaimers.

Jaw-Boning at the Fed

Contributor Image
David Blitzer

Former Managing Director and Chairman of the Index Committee

S&P Dow Jones Indices

When the FOMC minutes were released on Wednesday (August 21st) at 2:00 PM analysts and investors combed through all ten pages looking for some hint of when QE3 might be tapered or what new trigger was be watched by the Fed.  This was old news from a time capsule:  The meeting was three weeks earlier and the minutes don’t mention anything that happened since the meeting.  Why is old news more important than the data and market action reported since the end of July?  The newer news included unemployment, inflation, industrial production, car sales and housing starts as well as a new record high and subsequent 4% drop in the stock market.

The Fed’s monetary policy tools are no longer limited to open market operations, reserve ratios or the Fed Funds rate. What they say is now as important as what they do.  This shift goes back to 2003 when the FOMC began issuing statements immediately after their meetings.  “Talk policy” expanded further under Ben Bernanke with press conferences and even a brief course on monetary policy and the Great Recession at the George Washington University.  Gillian Tett writes in the Financial Times that other central banks are following the Fed in trying to talk the economy forward and that the development is being studied by Douglas Holmes, a professor of anthropology.

Increased communication is welcomed by most investors and analysts as greater transparency.  However, we need to recognize what is happening.  The central bank is not simply opening its kimono, it is using its speeches and reports in an effort to encourage us to accept its view of the economy and act accordingly.  It tells us about QE3 to enhance its stimulative effects and encourage us to borrow or lend, and spend, to boost the economy.  This is rhetoric, not reporting; preaching as well as publication.

All this jaw-boning should be familiar to everyone in the financial markets.  Virtually every CEO and investor relations officer does this when they generously give “guidance” in forward looking statements about the next earnings report.  If they do it well, investors respond by buying their stock.

It wasn’t always like this.  Under Greenspan, Volcker and other Fed chairman, central bankers rarely spoke.  Fed watchers – monetary theory’s version of Kremlinologists – interpreted the Fed’s open market operations for the rest of us.  On rare occasions when the something needed to be said, the Fed chairman, disguised as an unnamed senior fed official, would grant an interview that always found its way to the front page of the Wall Street Journal.

The posts on this blog are opinions, not advice. Please read our Disclaimers.

Holding Bonds As Rates Rise

Contributor Image
Kevin Horan

Former Director, Fixed Income Indices

S&P Dow Jones Indices

This week’s FOMC minutes revealed that almost all the members of the committee agreed that it was not yet time to begin tapering the Fed’s asset purchases. Many committee members urged additional caution, and advocated waiting until more concrete evidence about the economy’s recovery was available. The report continued to explain that the members generally supported Fed Chairman Bernanke’s “contingent outlook”. The Fed’s inaction shows that its members are comfortable with waiting patiently as the economic recovery unfolds. Come the September FOMC meeting, however, and the Fed may begin to change its tune.

The bond market, which was already struggling to keep its head above water, took a dive after the FOMC minutes were released, as many investors took them to mean the central bank would begin cutting back on its bond buying program as soon as next month. The S&P/BGCantor U.S. Treasury Bond Index ended down 0.25% for the day, on top off its -0.84% loss month-to-date. Between the slow drawn-out economic recovery and heightened expectations surrounding the timing of the Fed’s tapering of its asset purchases, bond market yields have risen significantly. As the Fed scales back, and eventually ends, its stimulus, yields will continue to rise. Also, the Fed will likely keep the short-term Federal Funds Rate near zero at the start, if not all the way through the tapering process. The combination of these two events means that the yield curve should steepen with anchored short-term rates and increasing intermediate to long term rates. The yield of the S&P/BGCantor 7-10 Year US Treasury Bond Index is 36 basis points wider month-to-date, and long duration indices have been performing poorly as well, as seen by the maturity sub-indices of the broad S&P/BGCantor U.S. Treasury Bond Index in the table below. Unfortunately for investors the curve steepening is likely to continue, even as yields on long duration investments have become attractive and the continuing increase in rates pushes prices downward. Sticking with short durations, or implementing a laddering strategy out to the middle of the curve, will help. As short bonds in the laddering strategy mature, the money can be reinvested at the long end of the ladder and capture higher yields in a rising rate environment, while the short end of the ladder stay consistent as long as the Fed keeps the front end near zero.

Month-to-Date Yield Curve Shift 08-22-2013


Fixed Income Return 08-21-2013


Source:  S&P Dow Jones Indices as of Aug. 21, 2013. Tables & Graphs are provided for illustrative purposes.  This table may reflect hypothetical historical performance.  Past performance is not a guarantee of future results

The posts on this blog are opinions, not advice. Please read our Disclaimers.