Get Indexology® Blog updates via email.

In This List

Index Rehab: Is Backwardation Back In-Style?

Sell in May and go away. You’re sure?

Paying Too Much at the Pump?!

That Was Easy

Shorter Municipal Bonds Hang In There While Long Municipal Bonds Suffer

Index Rehab: Is Backwardation Back In-Style?

Contributor Image
Jodie Gunzberg

Former Managing Director, Head of U.S. Equities

S&P Dow Jones Indices

My colleague, David Blitzer, is discussing index construction in his blog series “Inside the S&P 500”, and so far has reviewed selecting stocks and the float adjustment. While the index construction principles of transparency, liquidity, and systematic rules-based methodologies are widely similar between equities, commodities and other asset classes, there are details that distinguish the asset classes. For example, market capitalization and style like growth or value may be associated with equities while credit quality and duration may be linked with bonds. The main features of commodity indices are weightings, rolls, and regions.

Since 2007, there have been a number of new commodity indices created to modify the first-generation flagships, the S&P GSCI and DJ-UBS, intended to improve the returns and reduce risk. However, as my colleague, Craig Lazzara, points out, newer developments to flagship indices don’t necessarily create smart beta so he prefers the term “alternative beta, because calling it smart beta implies the beta you get from the S&P 500 (or flagship) is dumb”.

He couldn’t have stated that concept any better for commodities. The S&P GSCI and DJ-UBS have been criticized for their basic strategy of holding the most liquid front-month contracts that lose from negative roll yield when exiting the expiring contract and entering the new contract every month when the later-dated contract is more expensive, or in contango. The blame comes from investors who were allocating to commodities in the time period between 2005 and 2011 when contango was the prevailing condition in 93% of months. For them, alternative beta that modified rolls or weights may have seemed to be the smarter solution since backwardation was a thing of the past. However, today that wisdom may not hold true because while the persistence of backwardation hasn’t been seen since prior to 2005, backwardation (as measured by the difference between the excess return and price return versions of the  S&P GSCI), appeared in 5 months in 2012 an has now continued this year since May.

There is a noticeable shift of world growth that may be causing backwardation to reappear. A number of characteristics of world growth driven by expansion of demand are becoming more widespread by the move from world growth driven by expansion of supply.  These factors are getting stronger since last year and they may drive the frequency and magnitude of cycles higher that may increase the incidence of switching between contango and backwardation.

New World

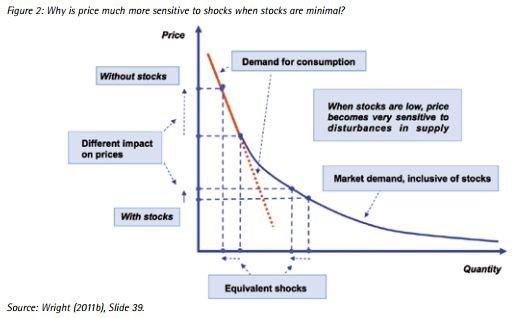
Also from this shift, the inventories are lower so commodities have been more sensitive to supply shocks than they have been in the past as evidenced by the moves in gold, livestock, and energy. Given that price shocks are differentiating factors between commodities, for example, a drought may affect corn but not gold or a pipeline burst may drive oil but not sugar, there should be more focus on fundamentals.  This is important since diversification may start to overcome the risk-on/risk off environment as discussed in a paper by Hilary Till, EDHEC-Risk Institute. (she will also discuss this in her keynote at our upcoming commodity seminar)

Price Sensitivity

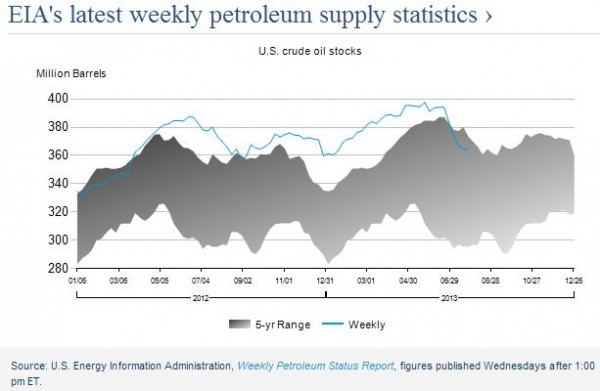
In the possible divergence of individual commodity performance, one component to watch is petroleum since the oil term structures are sensitive from the challenging storage situations. The global impact of the U.S. shale energy boom may be a significant force in shaping the return opportunities ahead just as the increased pipeline capacity has been supporting the S&P GSCI Crude Oil (WTI) and S&P GSCI Unleaded Gasoline.  The environment may have a large positive index impact from backwardation, particularly in the S&P GSCI with its relatively heavy energy weight. If this is the case, the index rehab that intended to upgrade the basics may have gone out of style – at least for now.


The posts on this blog are opinions, not advice. Please read our Disclaimers.

Sell in May and go away. You’re sure?

Contributor Image
Jamie Farmer

Former Chief Commercial Officer

S&P Dow Jones Indices

We’re all familiar with that old adage.  The theory says that trading slows during the summer months, markets can be a bit more turbulent and you’re better off closing out your positions, getting to the beach and enjoying your Pimm’s Cup in relative peace.

But as my colleague Craig Lazzara pointed in his recent post, investors that bailed out this May would’ve missed a decent July.  Further, we know that the adage isn’t an absolute.  Historically, it may be true that the 6 months from May to October underperform those from November to April, but that doesn’t mean there is no absolute performance to be gleaned.  Our cousin colleague Sam Stovall, chief equity strategist at S&P Capital IQ, says when stocks start the year off strongly there are often gains to be had during summer vacation (from his report “Sell in May and go…where?”, April 22, 2103).  And this year clearly did have a strong start, with the DJIA up 19.95% YTD through July.

So, how has this period performed in recent decades?  To compare this year to years past, we looked at the average price return of the Dow Jones Industrial Average from May to July.  This year’s performance of 4.45% compares very favorably to the average of .85% from 1950 to 2013 and is the best May to July period since 2003 when the DJIA was up 8.89%.  Over those 64 years, the split of positive vs. negative periods is exactly 50/50 – positive periods average a 5.98% gain and the negative average a 4.28% loss.

As always, investors are best served by not accepting the conventional wisdom at face value.

The posts on this blog are opinions, not advice. Please read our Disclaimers.

Paying Too Much at the Pump?!

Contributor Image
Jodie Gunzberg

Former Managing Director, Head of U.S. Equities

S&P Dow Jones Indices

Why are gas prices so high? I know I’m not alone as “a commodity lady” wondering this as I pull out my credit card to pay at the pump. (Which is not often since I ride my bicycle to work most days)

US Gas Prices

Gasoline prices typically rise in the summer because more people travel to take vacations. However, this July, the S&P GSCI Unleaded Gasoline  gained 12.0%, which was the 4th highest increase in July in the history of the index (since 1988,) and the biggest rise in July since 2005 when the index increased 13.6%. The other years with big July increases were 1990, up 19.0%, and 2004, up 14.7%. While the index fell 11.1% in Aug 2004, it rose 17.6% in Sept that year. However, August 1990 and August 2005 subsequently jumped significantly, up 49.5% and 36.6%, respectively.  It will be interesting to see where gas price go this August.

Why has this summer’s gas price increased so much? Finding and producing crude oil, the input to unleaded gasoline is difficult and expensive. Today, American oil reserves tend to lie in shale formations or in deposits under the ocean floor.

Finding Crude Oil

Since many easy-to-access oil reserves have already been tapped, more expensive technology is required to reach new reserves. The higher production costs drive higher gasoline prices as crude oil is the main substance in gasoline, which powers our transportation.

The S&P GSCI Crude Oil has a gained a total of 17.5% since May which is the most since Oct 2011. It gained 9.2% in July, the biggest monthly increase since Aug 2012 when it was also up 9.2%. This increase is from new infrastructure that has helped drain supplies and inventories from the U.S. benchmark supply point at Cushing, Oklahoma. The U.S. government data showed oil inventories at the Cushing, Oklahoma, delivery point fell for a fifth straight week to the lowest since April 2012. See the chart below from the U.S. EIA (Energy Information Administration)

Crude Oil Stocks

Also BP Plc’s new 250,000 barrel per day crude distillation unit at its Whiting, Indiana, refinery started up at the end of June, increasing demand.  This in conjunction with the U.S. Federal Reserve announcing plans to continue its $85 billion a month purchases of mortgage and Treasury securities to back the economy has supported oil prices. If the Fed eases up on the stimulus program, generally that might slow the economy and potentially drive down oil prices, then prices at the pump may come back down.

The posts on this blog are opinions, not advice. Please read our Disclaimers.

That Was Easy

Contributor Image
Craig Lazzara

Former Managing Director, Index Investment Strategy

S&P Dow Jones Indices

If every month were like July, equity investors would have an easy life.  The most striking thing about July’s U.S. equity market performance was how consistently good it turned out to be.  The S&P 500 was up +5.09%, with the Mid Cap 400 ahead of that pace (+6.20%) and the Small Cap 600 further ahead yet (+6.84%).  All 10 S&P 500 sectors rose, and all but one were up by +4% or more.  Value was marginally ahead of growth, yield-tilted strategies were ahead of vanilla, and (unsurprisingly for a +5% month), High Beta beat Low Volatility. Volatility itself declined sharply, as it typically does in good markets, although our Dynamic VEQTOR Index turned in a positive (+2.31%) result.

The international equity markets were also up strongly, with the S&P Europe 350 gaining +7.42% to pace the field.  Emerging markets (+0.83%) were much weaker than their developed counterparts, with Latin America (-1.64%) proving a drag on performance.  Even commodities had a good month, led by their energy components — the Dow Jones-UBS Commodity Index rose by +1.36%, and the more energy-laden S&P GSCI gained +4.91%.

Of course, there’s a dark lining in every silver cloud, and this month, as in May and June, long-term interest rates rose.  The S&P/BGCantor 20+ Year U.S. Treasury Index fell -1.61%, with its 7-10 year counterpart off -0.43%  Shorter duration indices dodged the bullet; the S&P/LSTA U.S. Leveraged Loan 100 Index gained +1.22% in July.

The posts on this blog are opinions, not advice. Please read our Disclaimers.

Shorter Municipal Bonds Hang In There While Long Municipal Bonds Suffer

Contributor Image
J.R. Rieger

Former Head of Fixed Income Indices

S&P Dow Jones Indices

Fund outflows in the municipal bond asset class, in part driven by the Detroit bankruptcy, pushed municipal bond performance down in July according to the S&P National AMT-Free Municipal Bond Index.


Other Sectors and Asset classes:

July 2013

 YTD
S&P Municipal Bond California Index

-0.95%

-3.64%
S&P Municipal Bond Illinois Index

-1.23%

-3.70%
S&P Municipal Bond Michigan Index

-1.28%

-3.87%
S&P Municipal Bond New York Index

-0.81%

-3.45%
S&P Municipal Bond Puerto Rico

-4.18%

-6.61%
S&P Municipal Bond High Yield

-2.12%

-3.58%
Investment Grade Corporate Bonds
S&P U.S. Issued Inv Grade Corp Bond Index

+0.68%

-2.47%
High Yield Corporate Bonds
S&P U.S. Issued High Yield Corp Bond Index

+1.70%

+2.88%


The posts on this blog are opinions, not advice. Please read our Disclaimers.