Get Indexology® Blog updates via email.

In This List

THE Golden Question?

Does Past Performance Matter?

When Diversification Fails

Where's the beef?

Passive Pensions

THE Golden Question?

Contributor Image
Jodie Gunzberg

Former Managing Director, Head of U.S. Equities

S&P Dow Jones Indices

What is your long term outlook for gold and where do you see prices moving in the months ahead?

This is one of the questions I was recently asked in a Reuters CCTV2 interview.  While we are not in the business of forecasting, we are in the indexing business where we measure markets – and gold is one of those markets.

Oftentimes the future follows history, so historical index levels are a reasonable place to look in order to get a feel for how prices have behaved in the past.  Please see below for a chart of historical levels of the S&P GSCI Gold.

Source: S&P Dow Jones Indices.  Data from Jan 6, 1978 to July 25, 2013.  Past performance is not an indication of future results.  This chart reflects hypothetical historical performance.  Please see the Performance Disclosure at the end of this document for more information regarding the inherent limitations associated with backtested performance.
Source: S&P Dow Jones Indices. Data from Jan 6, 1978 to July 25, 2013. Past performance is not an indication of future results. This chart reflects hypothetical historical performance. Please see the Performance Disclosure at the end of this document for more information regarding the inherent limitations associated with backtested performance.

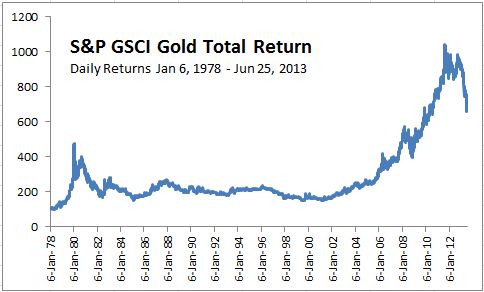
As I pointed out in a previous post, gold is having its worst year since 1980.  From Jan 1980 until June 1982 gold in the index lost 65%, then rebounded 69% by Jan 1983.  This time gold’s bottom – so far – was on June 27, down 37% from its peak in Aug 2011. This month it is up 8.5% so if the rally looks like last time, there may be about 30% left, but that is only if the rally this time follows the symmetry of history. Another possibility is that gold could fall another 30% and have a loss like in the 1980-82 period.

What prompted the interview on July 22 was the biggest one day move of gold since June 29, 2012. See the Q&A below for the OTHER GOLDEN QUESTIONS:

1. Gold reached a one month high earlier today – it was the biggest 1-day rally in over a year. What triggered today’s rally?  Gold gained 3.6% in the S&P GSCI and DJUBS mainly on some weaker than expected data from the Fed that drove the price higher than 1300, an important point for technical traders. It went further and  broke 1307, then 1315.

2. Why has gold dropped precipitously this year? Gold had it worst two days since 1980 mainly since the US Fed announced in June it would slow its quantitative easing. The demand for gold as a safe haven may have disappeared after that announcement.

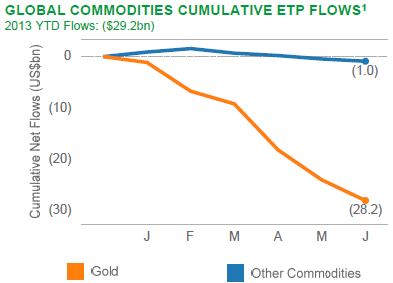
3. And – what’s behind the 10% rebound this month? The rebound is on the fundamental story of expanding reserves from the banks, whether it’s the Fed, ECB or Bank of Japan, the demand is picking up while the ETF selloff seems to have eased.

Source: Blackrock. ETP Landscape, Industry Highlights, June 30, 2013.

4. Why have commodities become more sensitive to supply shocks? And what does this mean for an investor’s strategy? The world’s economy may be shifting from one driven by expansion of supply to one driven by demand. In that case, inventories may be lower so commodities will be more sensitive to supply shocks. For investors, it means they may benefit from strategies that are more flexible to change weights or contracts based on the fluctuations of inventory and price.

5. Why are we seeing an unprecedented summer surge in exports of gasoline, diesel and other fuels?  There is an oversupply from a demand decline from Asia’s slowdown. Gasoline exports may slow as refiners hit their sales quotas before the government decides whether to increase allocations. Read more from this Bloomberg article.

6. Who is benefiting from this surge?  International consumers benefit from the supply spillover into their respective regions. Generally, the higher the inventory, the lower the prices.

7. And how is this export boom affecting pricing in the oil market? The refiners are the consumers of oil to make the gasoline so if demand slows the impact on oil is negative. However, it varies by regional fundamentals as evidenced by the 14.3% gain in the S&P GSCI (WTI) Crude Oil versus only 80 basis points in more international S&P GSCI Brent Crude. Read more from this Reuters article.

The posts on this blog are opinions, not advice. Please read our Disclaimers.

Does Past Performance Matter?

Contributor Image
Aye Soe

Former Managing Director, Global Head of Core and Multi-Asset Product Management

S&P Dow Jones Indices

The phrase “past performance is not a guarantee of future results” has never rung more true for active mutual funds.  Our semi-annual publication, the Persistence Scorecard, takes a look at the performance of top quartile active funds over three- and five-year consecutive 12-month periods.  Based on the most recently released report, out of 269 large cap funds that were in the top quartile as of March 31 2011, only 3.35% (amounting to only 9 funds) remain in the top quartile at the end of March 2013.  It is worth noting that of the 102 mid cap funds that were in the top quartile, there was none left at the end of March 2013.

In short, the report is a sobering reminder that we cannot use the past performance figures as the sole or the most important criteria in fund selection.  In addition, the transition matrices in Report 4 and 5 suggest that a healthy percentage of top quartile funds in the subsequent period come from prior period second or third quartiles.


The posts on this blog are opinions, not advice. Please read our Disclaimers.

When Diversification Fails

Contributor Image
Craig Lazzara

Former Managing Director, Index Investment Strategy

S&P Dow Jones Indices

Diversification means different things in different contexts.  We can speak, for example, of diversification within an equity portfolio — i.e., of holding a number of stocks with potentially-offsetting risks, as opposed to concentrating on only one issue or on a handful of similar stocks.  Or we can think of diversification across asset classes — e.g., by adding bonds, or international stocks, or commodities to a (diversified) U.S. equity portfolio.  Conventional wisdom smiles on these two forms of diversification, and rightly so, since the final diversified portfolio typically has a higher expected return, or lower expected risk, than the starting portfolio.

But diversification might not always be a good idea.  Suppose I go a casino, find the roulette wheel, and bet on a number at random.  I’m likely to lose my money.  If I do the same thing a second time, and a third, the result is likely to be the same.  I haven’t created a diversified portfolio of bets — I’ve merely repeated the same mistake several times over.

A recent white paper asks whether the selection of active investment managers is a useful or fruitless form of diversification.  (Spoiler alert: fruitless.)  Why?  Active managers, more often than not, underperform the indices against which they’re benchmarked.  An investor who chooses an actively-managed fund over an index fund is therefore more likely than not to underperform.  Adding a second and third actively-managed fund is likely to leave the investor worse off than he was with only one (just as multiple turns at the roulette wheel are likely to leave a gambler poorer than he was after his first bet).

If it were easy to find outperforming active funds, diversifying active management might be beneficial.  But it’s not easy — and that implies, as discussed here, that picking active managers is one of those areas where diversification fails.

The posts on this blog are opinions, not advice. Please read our Disclaimers.

Where's the beef?

Contributor Image
Jodie Gunzberg

Former Managing Director, Head of U.S. Equities

S&P Dow Jones Indices

While I was eating at a well-known restaurant chain, I saw this sign in the front window:

Where's the beef?

So of course as a commodity lady my mind doesn’t think about choices like chicken or veggies, but I wonder what happened to the price of beef in the shortage and why is there a shortage?  

The S&P GSCI All Cattle, which includes both the S&P GSCI Feeder Cattle and Live Cattle, has gained 4.4% since the end of May, after losing 8.6% from the beginning of the year. See the monthly returns in the table below:

Source: S&P Dow Jones Indices.  Data from Jan 2013 to July 17, 2013.  Past performance is not an indication of future results.  This chart reflects hypothetical historical performance.  Please see the Performance Disclosure at the end of this document for more information regarding the inherent limitations associated with backtested performance.
Source: S&P Dow Jones Indices. Data from Jan 2013 to July 17, 2013. Past performance is not an indication of future results. This chart reflects hypothetical historical performance. Please see the Performance Disclosure at the end of this document for more information regarding the inherent limitations associated with backtested performance.

An obvious driver is that the grilling season has kicked in, but that is on the demand side. Also on the demand side, as reported in the United States Department of Agriculture (USDA) report on July 11 was U.S. beef exports rose 4.3% in May from a year ago for muscle meats and 2.7% for total beef and beef variety meat sales. The increase was from a 74% increase in sales to Japan, which eased its age requirement on U.S. beef to cattle under 30 months of age from 20 months or younger.

In addition to the rising demand, the summer heat has disrupted supply since cattle eat less when it’s hotter outside. Also the drought conditions have affected rangelands, leaving little water and forage for livestock, prompting the Bureau of Land Management (BLM) to undertake targeted actions, such as reducing grazing.

Last year beginning in May, the S&P GSCI All Cattle had a 4 month winning streak driving the index up 7.9% before a small dip in Sep of 1.1%. By the year’s end the index gained 13.3% from the trough in Apr. Could the drought in 2013 drive similar shortages and higher returns as from the 2012 drought? Compare droughts here.

The posts on this blog are opinions, not advice. Please read our Disclaimers.

Passive Pensions

Contributor Image
Craig Lazzara

Former Managing Director, Index Investment Strategy

S&P Dow Jones Indices

We read this morning that the California Public Employees’ Retirement System (CalPERS) is considering increasing its commitment to passive equity vehicles. This follows, by less than two weeks, a study suggesting that public pension funds generally could improve their performance by doing exactly what CalPERS is reported to be considering.

Of course whenever you speak about CalPERS, you’re speaking about enormous size (at $256 billion, the nation’s largest pension fund), and the fund’s size may be a key to its plans. For CalPERS to move its figurative needle, it needs to generate a huge amount of active investment return. As readers of our SPIVA reports know, most active managers underperform most of the time, so CalPERS may well conclude that the active management game isn’t worth the candle, especially at the scale required for their asset base. If that’s what they decide, it would be a hard conclusion to dispute.

The posts on this blog are opinions, not advice. Please read our Disclaimers.