Get Indexology® Blog updates via email.

In This List

25 and Counting for the Dow

Ready to Roll or Need to Weight?

New Highs for the S&P 500 and the Dow Jones Industrials

After The Fireworks

Inside the S&P 500: Selecting Stocks

25 and Counting for the Dow

Contributor Image
Jamie Farmer

Former Chief Commercial Officer

S&P Dow Jones Indices

The number 25.  Christmas Day.  The atomic number of manganese.  The jersey number typically reserved for a baseball team’s best slugger.  And to date in 2013, the number of new highs hit by the Dow Jones Industrial Average.  Year to date through Friday (July 12) the Dow, ending the session at 15,464.30, has closed at a new high 25 times.  How does this compare to years past?  Well, it’s a pretty active pace – the DJIA is up over 18% on the year – but still a ways off the record.  In the 118 years since the DJIA’s inception, the most active year for new highs was 1995 when the DJIA hit a record close 69 times.  2007, in the lead up to the great recession, is on the list with 34 new highs.  With about 5 ½ months left to go – and with no apparent end to the Fed’s QE actions – 2013 currently ranks 24th on the list.  Keen observers of the list below will also note some other significant numbers: 1929 and 1987, years associated with historic equity market declines.

25 and Counting for the Dow

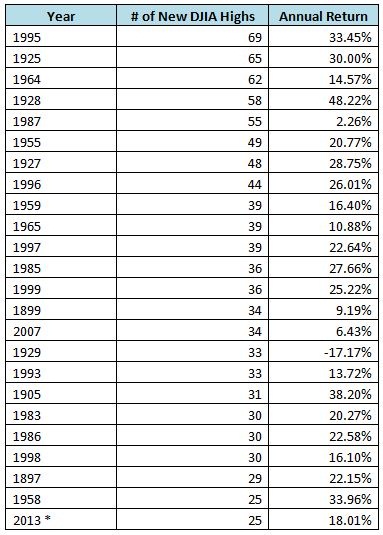
Source: S&P Dow Jones Indices. Data is through July 12, 2013.

The posts on this blog are opinions, not advice. Please read our Disclaimers.

Ready to Roll or Need to Weight?

Contributor Image
Jodie Gunzberg

Former Managing Director, Head of U.S. Equities

S&P Dow Jones Indices

In the past few years a number of indices have been launched with a goal of minimizing the impact of contango.  The first indices launched with this goal were the simple (1-5 month) forward indices and the relatively static S&P GSCI Enhanced. In the time period from Aug 2004-May 2011, mentioned in my prior post, these indices did the job of outperforming the front month contracts in the S&P GSCI by reducing the negative impact from contango as shown in the chart below.

Source: S&P Dow Jones Indices.  Data from Aug 2004 to May 2011.  Past performance is not an indication of future results.  This chart reflects hypothetical historical performance.  Please see the Performance Disclosure at the end of this document for more information regarding the inherent limitations associated with backtested performance.
Source: S&P Dow Jones Indices. Data from Aug 2004 to May 2011. Past performance is not an indication of future results. This chart reflects hypothetical historical performance. Please see the Performance Disclosure at the end of this document for more information regarding the inherent limitations associated with backtested performance.

However, 2012 told a different story, where the S&P GSCI 3-Month Forward and S&P GSCI Enhanced underperformed the S&P GSCI by 1.6% and 0.3%, respectively, but the S&P GSCI still was not the star performer. The S&P GSCI Dynamic Roll outperformed the S&P GSCI by 2.3% for the year.

So, the front month paid off but the flexibility to switch to contracts with different expiration dates on the curve was more lucrative.  Now the question is whether as good a result may have been achieved by changing weights rather than rolls (contracts) based on the term structure. In order to help answer this question please see the following chart:

Source: S&P Dow Jones Indices.  Data from Aug 2004 to July 11, 2013.  Past performance is not an indication of future results.  This chart reflects hypothetical historical performance.  Please see the Performance Disclosure at the end of this document for more information regarding the inherent limitations associated with backtested performance.
Source: S&P Dow Jones Indices. Data from Aug 2004 to July 11, 2013. Past performance is not an indication of future results. This chart reflects hypothetical historical performance. Please see the Performance Disclosure at the end of this document for more information regarding the inherent limitations associated with backtested performance.

Immediately noticeable over the entire time frame from Aug 2004 -Jul 2013, is the gain earned by moving from the S&P GSCI, which has a world production weighting of 24 commodities, to the S&P GSCI Equal Weight Select, which includes a sampling of the most liquid commodities from each sector of the S&P GSCI to reduce the number of constituent to 14 commodities that are equally weighted.  In 2012, the S&P GSCI Equal Weight Select gained 3.1% versus the S&P GSCI which was up 0.1%. The next improvement is earned by changing the weights from the S&P GSCI Equal Weight Select based on the change in realized roll yield as illustrated in the newly launched  S&P GSCI Roll Weight Select, which gained 4.0% in 2012. Finally in the chosen period, the S&P GSCI Dynamic Roll Equal Weight Select, which only changes the contract based on implied roll yield when compared to the S&P GSCI Equal Weight Select, added the most value overall. However, the S&P GSCI Dynamic Roll Equal Weight Select only gained 3.6% in 2012.

It is possible there is more of a premium to be gained by giving up some liquidity as the contracts are longer-dated but it may depend on the time-frame. Overall, whether the better choice is to roll or to weight may just depend on how long the wait is to roll or to weight.


The posts on this blog are opinions, not advice. Please read our Disclaimers.

New Highs for the S&P 500 and the Dow Jones Industrials

Contributor Image
David Blitzer

Former Managing Director and Chairman of the Index Committee

S&P Dow Jones Indices

The S&P 500 closed at a new all-time high this afternoon at 1675.02, up from the previous record at 1669.16 set on May 21st and the Dow Jones Industrial Average closed at 15460.92 setting a record and up from 15409.39 on May 28th.

What does a new high mean? Good copy for journalists, positive reinforcement for investors that they made the right choice and hope for yet another new high.  New highs also mean that investors are getting wealthier and might help the economy with some spending. A rough guess is that at these index levels, each one point increase in the S&P 500 adds close to one billion dollars to portfolios tracking the index all around the world.  It also adds roughly nine times that to other portfolios holding some index stocks but not tracking the whole list.  The stock market and the S&P 500 do reflect investor sentiment and are leading indicators for the U.S. economy. Today’s closing high may have been an immediate result of comments Fed Chairman Bernanke made yesterday – they are also another sign that the economy is looking up and that the Fed’s past efforts are producing some positive results.

The posts on this blog are opinions, not advice. Please read our Disclaimers.

After The Fireworks

Contributor Image
Kevin Horan

Former Director, Fixed Income Indices

S&P Dow Jones Indices

It was back to business in the U.S. after the July 4 holiday, which fell on a Thursday this year and made for a much needed four day weekend. The bond markets had a lot to look forward to this week as the Treasury auctioned a total of $66 billion of issuance in three, 10, and 30-year paper. The auctions saw investors take advantage of higher yields that have resulted from the post FOMC meeting announcement of June 19. The July 10,2013, release of the Fed’s minutes from the June 18-19 FOMC meeting contained mixed language referring to “many” officials wanting to see more signs that employment is picking up before they would be willing to begin slowing the pace of their market stimulus. The Fed has been purchasing $45 billion of Treasuries and $40 billion of mortgage backed securities for a total of $85 billion in monthly stimulus. The S&P/BGCantor 7-10 Year U.S. Treasury Bond Index’s yield, which topped out at 2.47% on July 5, was returning to its recent peaks, closing at 2.43%. Shortly after the release of the meeting notes, Fed Chairman Ben Bernanke was quoted as saying “highly accommodative monetary policy” is needed for the foreseeable future as a jawboning action to stem the recent market sell-offs. The following day, bonds rallied as the July 11 number of initial jobless claims unexpectedly increased to a two-month high of 360,000. In the end, market participants remain suspicious that policy makers remain committed to slowing asset purchases, and this week’s report hints that more policy makers are getting behind a shorter time frame than previously thought. The S&P/BGCantor U.S. Treasury Bond Index, which measures the performance of all notes and bonds, has returned -0.49% month-to-date and is down -2.02% year-to-date.

Investment grade bonds, as measured by the S&P U.S. Issued Investment Grade Corporate Bond Index, are looking to crawl back from a difficult past two months (-2.25% in May, -2.49% in June). The index is currently returning -0.54% month-to-date and -3.65% year-to-date. The longer maturities of the index, which average 9.75 years and duration of 6.36 years, hurt the index at a time when short durations were the only protection to interest rate risk.

Leveraged loans, on the other hand, have held a steady return of 0.37% for the month and 2.33% for the year as measured by the S&P/LSTA U.S. Leveraged Loan 100 Index.

Usually, the high yield market is mostly concerned with credit stories. The focus of portfolio managers is on company fundamentals, earnings projections, and management teams. That is one reason why, at times, market participants look to the equity markets as much as the fixed income markets when studying high yield. Last month added an additional twist as interest rate risk became just as important to this segment of the market as the rest of the bond markets. After a crushing -2.56% return for June, the S&P U.S. Issued High Yield Corporate Bond Index has been able to squeeze out a month-to-date return of 0.26%. The index is still in the green with a 1.42% year-to-date return. When looking at just price return, the index is actually down -2.2% for the year, but a significant amount of the return is its higher yielding income return, which has added 364 basis points year-to-date.

Fixed Income Total Return Table as of 20130710


The posts on this blog are opinions, not advice. Please read our Disclaimers.

Inside the S&P 500: Selecting Stocks

Contributor Image
David Blitzer

Former Managing Director and Chairman of the Index Committee

S&P Dow Jones Indices

This is the first of a series of posts describing how S&P Dow Jones Indices and its US Index Committee maintain the S&P 500. Future posts will cover how stocks react when added to the index, the mix of sectors and industries in the index, the Index Committee and how the index can be used to develop strategy indices.

In most years 25 to 30 stocks in the S&P 500 are replaced.  Exits are often caused by mergers or acquisitions, sometimes with another company in the index.  There are occasional bankruptcies and a few cases where the Index Committee removes a stock because it clearly doesn’t fit in the index.  Few people ask about the exits, but everyone wants to know how the additions are selected.

Selecting a stock for the S&P 500 is not an investment recommendation; stocks are chosen so that the overall index represents and reflects the large cap segment of the US equity market.

There are guidelines for stocks for the S&P 500:

  • Market cap should be $4.6 billion or more
  • Stock should be liquid with at least 100% annual turnover of float shares
  • U.S. company
  • Public float greater than 50%
  • Financially viable meaning four consecutive quarters of positive earnings under GAAP
  • Contribute to the maintenance of the sector balance of the index compared to the market based on the market value of the ten GICS® sectors.

All these apply at the time a company joins the index.  If a company’s market value drops from $5 billion to $4.5 billion after entering the index, it won’t be immediately kicked out. But, if over time it comes to substantially violate some of the guidelines, the Index Committee may decide that another company would be a better fit in the index. The requirement of U.S. companies is one which led to lots of discussion in recent years. There was a time when a company’s legal incorporation was the only factor determining its nationality.  Today with global corporations incorporated in one country, traded in another and earning revenues and profits in all over the world, deciding the nationality, or domicile, isn’t easy.  From discussions with investors and advisors, the most important factors for nationality are the stock’s primary listing, which country’s laws and which exchange’s rules govern its financial reporting, where its operations and headquarters are located and where it is incorporated.  While some companies in the S&P 500 are incorporated outside the US, their primary exchange is either the NYSE or NASDAQ. All companies in the S&P 500 report to the SEC as a US company.

The basis for the size, liquidity, and public float guidelines is well understood.  Part of assuring that the index represents the market is keeping the balance of sectors in the index close to the balance in the market.  If the weight of one sector in the index is much less than its weight in the overall market, the Index Committee may try to adjust sector balance through the next stock chosen.  However, the myth that the chosen stock is always in the same sector as the one it replaces is not true.  On one hand, the existence of a few large stocks that don’t meet the guidelines means that the sector balance will never be exact while on the other sector balance will always be fairly close because the S&P 500 includes about 80% of the total market value.

Applying these guidelines to companies not currently in the S&P 500 yields a list of several candidates for the S&P 500.  The selection is made by the Index Committee. In addition to sector balance, other factors considered in the selection are the event (acquisition, merger, bankruptcy, etc.) forcing the removal of a company, the size of the companies being dropped and added and announced future corporate actions.  In all these decisions, the objective is to assure that the S&P 500 continues to represent the large cap US equity markets while keeping turnover and trading low.

More information about the index can be found on S&P Dow Jones web site.

The posts on this blog are opinions, not advice. Please read our Disclaimers.