Get Indexology® Blog updates via email.

In This List

Keeping Up With Contango's Twist

What the Jobs Report Means for Interest Rates

Getting What You Pay For

June 2013: What's Hot and What's Not

Dividends: Love'm or Leave'm

Keeping Up With Contango's Twist

Contributor Image
Jodie Gunzberg

Former Managing Director, Head of U.S. Equities

S&P Dow Jones Indices

As mentioned in an article today in the Wall Street Journal, there may be a shift taking place in the commodities markets. In simple terms, there may be more predominant shortages of commodities.

Generally as inventories are abundant, there are higher storage costs, which reduce returns from a condition called contango where the longer-dated contracts are more expensive than near contracts.  As the inventories deplete, shortages may prevail, giving no value to storage for commercial consumers that need the commodities to make their goods, which is reflected in an opposite and profitable condition called backwardation.  This is shown below:

Chart is provided for illustrative purposes only.

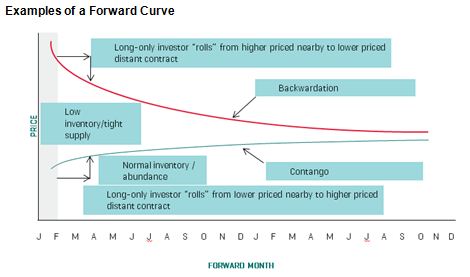
From Feb 1970 through June 2013, commodities have spent 58% of the 521 months in contango, which makes sense given the long-term cycles of inventory building and depletion. Please see this illustrated in the following chart where backwardation or contango was determined by the sign of the S&P GSCI spot version subtracted from the S&P GSCI Excess Return. A positive (negative) result indicated backwardation (contango):

Source: S&P Dow Jones Indices.  Data from 1970 to 2012.  Past performance is not an indication of future results.  This chart reflects hypothetical historical performance.  Please see the Performance Disclosure at the end of this document for more information regarding the inherent limitations associated with backtested performance.
Source: S&P Dow Jones Indices. Data from 1970 to 2012. Past performance is not an indication of future results. This chart reflects hypothetical historical performance. Please see the Performance Disclosure at the end of this document for more information regarding the inherent limitations associated with backtested performance.

However, what is most interesting about this chart is the historical pattern of backwardation and contango. Notice prior to August 2004, the number of months spent in backwardation and contango were split 50%/50% and were mostly cyclical. Between Aug 2004 and May 2011, the environment was different and there were 79 of 82 months in contango, reflecting a time of excess inventory from the rush to supply closely followed by the demand destruction of the global financial crisis. Post May 2011, 1/3 of months have been in backwardation with 3 months occurring in 2011, 5 months in 2012 and 2 in 2013 (May and June).

What does it mean? If there is a shift in environment going forward towards a world driven by expansion of demand, then backwardation may be more likely with more frequent cycle switching. If this is the case, then like in 2012, the fixed forward indices such as the S&P GSCI 3-Month Forward may underperform the S&P GSCI (which holds the nearby most liquid contracts) and more dynamic indices like the S&P GSCI Dynamic Roll (which changes contracts based on term-structure) and the newly launched S&P GSCI Roll Weight Select (which changes weights based on term-structure).

The posts on this blog are opinions, not advice. Please read our Disclaimers.

What the Jobs Report Means for Interest Rates

Contributor Image
David Blitzer

Former Managing Director and Chairman of the Index Committee

S&P Dow Jones Indices

The employment report released on July 5th showing 195,000 new jobs and the unemployment rate remaining at 7.6% increase the likelihood that the Fed will begin to slow bond purchases late this year, end bond purchases in mid-2014 and begin to raise the Fed Funds rate in 2015.  As explained on the Atlanta Federal Reserve’s blog the report is consistent with the Fed’s own projections.  Assuming job growth continues at about the pace seen in the last few months and that the labor force participation rate holds steady, unemployment would move to 7.26% in December 2013, 6.92% in mid-2014 and 6.25% in Mid 2015.

If this is correct, and if the Fed sticks to its current guidance about the Fed funds rate, the Fed Funds rate will remain in the current 0 to 25 bp range until sometime in the first half of 2015 as the yield curve steepens slightly until then.  The probable slowing of bond purchases most likely means further increases in bond yilelds over the next couple of years.  The implications for stocks and gold depend on the economy and inflation as well as the Fed.  If the economy does as well as the Fed expects, stocks should avoid a major set back.  Under the Fed’s outlook, with continued low inflation, gold won’t have much reason to reverse its recent decline.

The posts on this blog are opinions, not advice. Please read our Disclaimers.

Getting What You Pay For

Contributor Image
Craig Lazzara

Former Managing Director, Index Investment Strategy

S&P Dow Jones Indices

Today’s Wall Street Journal, among others, reported on a recent study by the Maryland Public Policy Institute arguing that the public pension funds which pay the highest fees haven’t reaped the highest investment returns.  In fact, the study shows, it’s just the opposite — for the 5 years ended June 2012, the 10 states which paid the lowest fees outperformed the 10 states which paid the highest fees.

This conclusion is reminiscent of a 2010 Morningstar study of mutual fund returns, which showed that low expense ratios were strong predictors of fund performance.  If fees and expenses are not predictive of returns, it follows that in the investment management world “you get what you pay for” is wrong, at least in a general sense.  If you got what you paid for, expensive funds and managers would outperform cheaper funds and managers.  If in fact it’s the opposite, that’s a powerful argument in favor of passive management.

None of this is news to readers of our SPIVA reports, which have demonstrated for years that most active managers underperform most of the time.  Passive management is not only a bargain — more often than not, it has enhanced returns as well.

The posts on this blog are opinions, not advice. Please read our Disclaimers.

June 2013: What's Hot and What's Not

Contributor Image
Jodie Gunzberg

Former Managing Director, Head of U.S. Equities

S&P Dow Jones Indices

Read about some commodity highlights in June from an interview with Courtney Nebons, our studio producer.  Click here to watch the video.

Q1.  This month we heard a lot about the Fed easing its monetary policy, so how did that impact commodities?

Commodities reacted negatively to the news that the Fed may ease its bond buying program since as the dollar strengthens, goods priced in dollars become more expensive for other currencies.  On June 20th, after the meeting all 24 commodities in the S&P GSCI fell, and the news sent Coffee, Nickel, Silver and Gold into bear markets for the year. Gold lost 12.2% in its worst month since January 1981.

Q2.  Was there anything else besides the quantitative easing driving down commodities this month?

The weather was an overarching theme, driving down grains and natural gas. Grains dropped 6.5% in June from adequately moist soil and larger than expected crop yields. The same mild weather also drove natural gas down 11% in June and is now at the same level as at the start of the year. At its peak on April 19 it was up 26.7% for the year from cold weather but as the weather warmed and inventories grew, the natural gas index gave up its gains.

Q3. Were any commodities hot like the weather?

In the index in June, livestock gained 3.1%, petroleum was up 3.0% and cotton was the big winner returning 7.8%.   Fundamentals were key to overriding the risk off declines from the quantitative easing.  For example, there is concern over a pig virus that may further curb production while meat-packers cut slaughter rates to offset tighter-than-expected seasonal hog supplies, which reduced the flow of pork to end-users at a time when demand heats up for summer vacations and outdoor cookouts.

Q4. Given crude oil is such a heavyweight, can you tell us briefly about the fundamental driver in that market?

WTI crude oil in the index was up 4.8% in June from the growing capacity to ship crude from the Cushing, Oklahoma delivery point in the U.S.

Q5. Is there anything else you would like to add?

Overall, the S&P GSCI was once again driven by the themes of the quantitative easing, Eurozone crisis, and Chinese demand. Although the quantitative easing and uncertainty over China’s demand were strong negative influences on commodities this month, the fundamentals prevailed pulling the index into positive territory, finishing up 23 basis points.

The posts on this blog are opinions, not advice. Please read our Disclaimers.

Dividends: Love'm or Leave'm

Contributor Image
Howard Silverblatt

Senior Index Analyst, Product Management

S&P Dow Jones Indices

Now that the short-term speculators have left the dividend market, core investors can get back to their boring stocks, collecting their tax advantaged yield (you may not like the increase to 20% from 15%, but I remember when it was 70%, and that was before New York State, City or unincorporated business tax got hold of you – talk about a minority interest).  The linked dividend report below is on U.S. domestic common stock for Q2 2013, and shows another good quarter.  My takeaway for the S&P 500 is below:

I expect dividend growth in the second half for the S&P 500 to be less than the first half due to the large December 2012 payout which was inspired by tax concerns.

The numbers works out to an upper-single digit second half increase, putting the 2013 dividend payment gain into double-digit territory.

The expected 2013 payment would set a new record over the current 2012 record – a year which included significant accelerated payments from 2013.

2013 would be the third double-digit gain in a row; the record is 4, set in 2004-7 and 1947-50.

2014, as the Fed would say, is data dependent (economy).

http://yhoo.it/120LeYu

The posts on this blog are opinions, not advice. Please read our Disclaimers.