Get Indexology® Blog updates via email.

In This List

"Hello Passive, goodbye active"

Damage Control

Volatility: Love It or Leave It

The Best of Times and the Worst of Times

After the crunch

"Hello Passive, goodbye active"

Contributor Image
David Blitzer

Former Managing Director and Chairman of the Index Committee

S&P Dow Jones Indices

The title is in quotes because it comes from FTFM, a supplement to the Financial Times reporting recent developments in the long running debat about active vs passive investing.

The SPIVA reports published by S&P Dow Jones Indices  show that actively managed mutual funds under-perform their index benchmarks more often than not.  For a long time this seemed to be a well kept secret. However, the rising popularity of ETFs have boosted the share of assets in passive or index-based investments.  Now comes a report that more and more investors — including active managers — are investing in passive or index-based investments.  FTFM reports that a “survey of 1001 fund management professionals — many of whom make their living promoting active products — showed that two-thirds have invested a sizeable amount of their personal savings in passive products. And 45% said they have invested a ‘significant portion’ in such funds.”

One source of the rising popularity of index investing, even among active fund managers, is the growth in strategy indices offering a wide range of investment strategies through ETFs.  While market cap weighted index funds based on the S&P 500 and other recognized indices continue to dominate the market, new ideas generate interest and attract assets.  A second reason for the growth of index investing is the fee differentials between passive and active management which favors passive investing.  Burton Malkiel who started the rush to passive investing with his book A Random Walk Down Wall Street  surveyed the field in a recent article in the Journal of Economic Perspectives.

The posts on this blog are opinions, not advice. Please read our Disclaimers.

Damage Control

Contributor Image
David Blitzer

Former Managing Director and Chairman of the Index Committee

S&P Dow Jones Indices

Compared to a month ago, every major developed equity market is down, some by double digits while bond yields have climbed over the same period.  The U.S. markets – both stocks and bonds — are among the least damaged.  For investors the questions are when will it end?, where can one hide? and why?

When will it end?

Assume that the Fed’s forecast is right and the economy is improving and will continue to improve.  Then the fortunes of stocks and bonds are likely to split with stocks recovering while bonds continue to suffer.  An improving economy should help stocks turnaround while the Fed’s less generous attitude  combined with economic strength means bond yields will rise more.  Markets tend to over react and overshoot when shocked as they were last week.  Beware a bounce in stocks or bonds creating a false sense of security for all. If the Fed is too optimistic and the economy falters, we will see QE4; but, we might be too nervous to take advantage of it.

Where can one hide?

Not bonds, maybe stocks. Maybe the silver lining is we’ve seen the first tiny steps to being able to earn a (small) return on cash.

What happened?

Everyone knew that one day the Fed would end Quantitative Easing but  everyone believed that that day would never come.  Then the Fed suggested a date – beginning of the end this fall, the end of the end next summer.  If your ten year treasury is worth 100 today and will be worth 90 next summer, you don’t wait  to sell it.  You sell it now and all that selling makes it worth 90 now. This is what happened.  Rather than complaining about the fickle Fed, remember their job is to worry about what could go wrong, lean against the wind and act as “the chaperone who has ordered the punch bowl removed when the party was really warming up.” (The quote is from William McC. Martin, Fed chairman in the 1950s and 1960s, credit to the Conversable Economist blog for the citation and a copy of the speech.)

Scorecard:

S&P 500 down 4.7% and DJIA down 4.3% from the close on Tuesday 6/18 to the close on Monday 6/24. 10 year Treasury note yield rose 38 bp or 17% over same time period.

The posts on this blog are opinions, not advice. Please read our Disclaimers.

Volatility: Love It or Leave It

Contributor Image
Craig Lazzara

Former Managing Director, Index Investment Strategy

S&P Dow Jones Indices

Investors are rightly concerned about the future course of equity prices, especially in the context of the Federal Reserve’s bruited tapering of QE3, and it’s obviously true that equity market volatility has increased sharply since the beginning of May. Rising volatility typically means lower stock prices — the correlation of the S&P 500 and the S&P 500 VIX Short-Term Futures Index is -0.78. If volatility continues to rise, what can equity investors do to diminish its impact?

An increasingly popular solution in recent years has been to use a variety of low volatility strategies as an alternative to traditional cap-weighted indices. Low vol indices are designed to attenuate the movements of their parent index, in both directions — they typically go up less when times are good, and go down less when times are bad. But although they may go down less when times are bad, they still go down. For the month of June (through the close on Friday 6/21), the total return of the S&P 500 was -2.23%, versus -1.38% for the S&P 500 Low Volatility Index. Low Vol did what it typically does in bad markets by diminishing the parent index’s decline.*

There’s another approach to dealing with increasingly volatile equity markets. That approach is to own a long position in VIX futures — in other words, to regard volatility as a diversifying asset for the investor’s equity portfolio. In this sense, volatility is analogous to an insurance policy. The problem is that when you don’t need it, volatility can be very expensive insurance. For the year ended 6/21/13, e.g., the S&P 500 VIX Short-Term Futures Index declined by -69% (while the S&P 500 rose by +23%).* Holding a permanent or static portfolio weight in volatility is likely to be an expensive exercise.

The S&P 500 Dynamic VEQTOR Index attempts to cheapen the implicit insurance cost of owning volatility by altering its relative exposure to VIX and the underlying S&P 500. (Hence the name: VEQTOR = Volatility and EQuity allocaTOR.) When it appears propitious to increase exposure to volatility (for example, when it’s in an uptrend), VEQTOR holds more. At other times, VEQTOR’s vol exposures can be quite modest. The combination of two negatively-correlated asset (equity and equity volatility) can produce a smoother, hedged pattern of returns, especially in comparison to a fully-invested equity index. For example, for the month of June (through the close on Friday 6/21), the total return of the S&P 500 Dynamic VEQTOR Index was +0.24%, compared to the S&P 500’s -2.23% decline.*

Volatility is uncomfortable for all equity investors. But it’s also unavoidable. Those who seek to lessen its effects can try to own it (with VEQTOR) or reduce it (with Low Vol). Both choices have their risks, and both have their potential rewards.

* Examples are provided for illustrative purposes only. Past performance is no guarantee of future results.

The posts on this blog are opinions, not advice. Please read our Disclaimers.

The Best of Times and the Worst of Times

Contributor Image
Craig Lazzara

Former Managing Director, Index Investment Strategy

S&P Dow Jones Indices

Since roughly the beginning of May, U.S. interest rates have been in an uptrend, with the 10 year Treasury note ending last week at a yield of 2.5%. Equity markets, not surprisingly, have reacted by weakening, especially in last week’s trading.

Some of us of a certain age will admit to a degree of bewilderment at this, since a 2.5% 10 year rate would have seemed ridiculously, if not unattainably, low for the vast majority of our working lives. Why are markets reacting so negatively to what, in most historical contexts, would have been considered a very favorable rate environment?

The answer lies in the distinction between high rates and rising rates. A 2.5% Treasury yield is unquestionably not high by any reasonable historical standard, but rates have equally unquestionably been rising for the last two months. When rates are stable, whether high or low, the equity market is priced to reflect their stability. When rates change, the equity market adjusts to reflect the change. As with many other phenomena in economics, it’s not the level of a variable that makes the difference, but the variable’s rate of change.

Stable rates, other things equal, enhance the stability of equity returns. Rising rates, if indeed they do continue to rise, may present a continuing challenge.

The posts on this blog are opinions, not advice. Please read our Disclaimers.
After the crunch

Contributor Image
David Blitzer

Former Managing Director and Chairman of the Index Committee

S&P Dow Jones Indices

500-10 yr

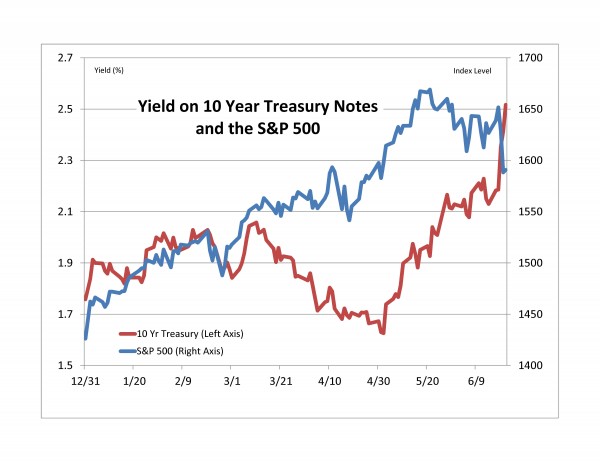
Friday afternoon and the markets survived the Fed’s pre-announcement of QE3’s demise.  The big move was in the yield on 10 year treasuries, now about 2.5%, the highest since August of 2011.  VIX broke through 20 the first time this year. The stock market is down but has only retraced its steps back to late April or early May.

Consensus outlook for the Fed is reductions in QE3 bond buying beginning in the fall and the complete end to QE3 sometime next summer.  Interest rates are expected to rise, but there is little agreement as to how much.  The Fed’s upbeat forecast for the economy of 3%-3.5% GDP growth in 2014 with continued low inflation is seen as a bit optimistic.

And now…

First, just because the Fed chairman Bernanke spent Wednesday afternoon explaining what the Fed expects and what it is likely to do, don’t believe it is locked-in or committed to a time table.  The Fed can, and frequently does, change its plans if the economy and markets change. One line many economists attribute to John Maynard Keynes is, “when the data change, I change my mind; what do you do?”  Whether or not the Fed economists are Keynesians, they do change their minds when the data change.

Second, if the Fed’s forecast turns out to be right – stronger growth, no inflation and less unemployment – the stock market’s prospects should look a whole lot better than in the last few days.  The market can advance when interest rates are rising, especially of the cause of rising rates is faster economic growth.

Third, not only is the rest of the world watching, and worrying, about the Fed; the Fed is also watching the rest of the world.  One wild card may be China where there are lots of signs that economic growth is slowing and short term interest rates spiked earlier this week.  Were Chinese economic growth to falter we would hear renewed concerns about the economy and speculation about continued quantitative easing.

Source: Data for the chart are daily data from 12/31/2012 to 6/21/2013 as of 6/21/2013. 10-year Treasury yield is from Bloomberg, S&P 500 is from S&P Dow Jones Indices. Past Performance is no guarantee of future results.

The posts on this blog are opinions, not advice. Please read our Disclaimers.