Get Indexology® Blog updates via email.

In This List

After the crunch

Risky Assets, Safe Havens, or Lost Identities?

Anticipation, It's Making Me Wait

Who's complaining, who's speculating, who's hedging and who's to blame?

S&P Dow Jones Raises Market Cap Guidelines for S&P 500

After the crunch

Contributor Image
David Blitzer

Former Managing Director and Chairman of the Index Committee

S&P Dow Jones Indices

500-10 yr

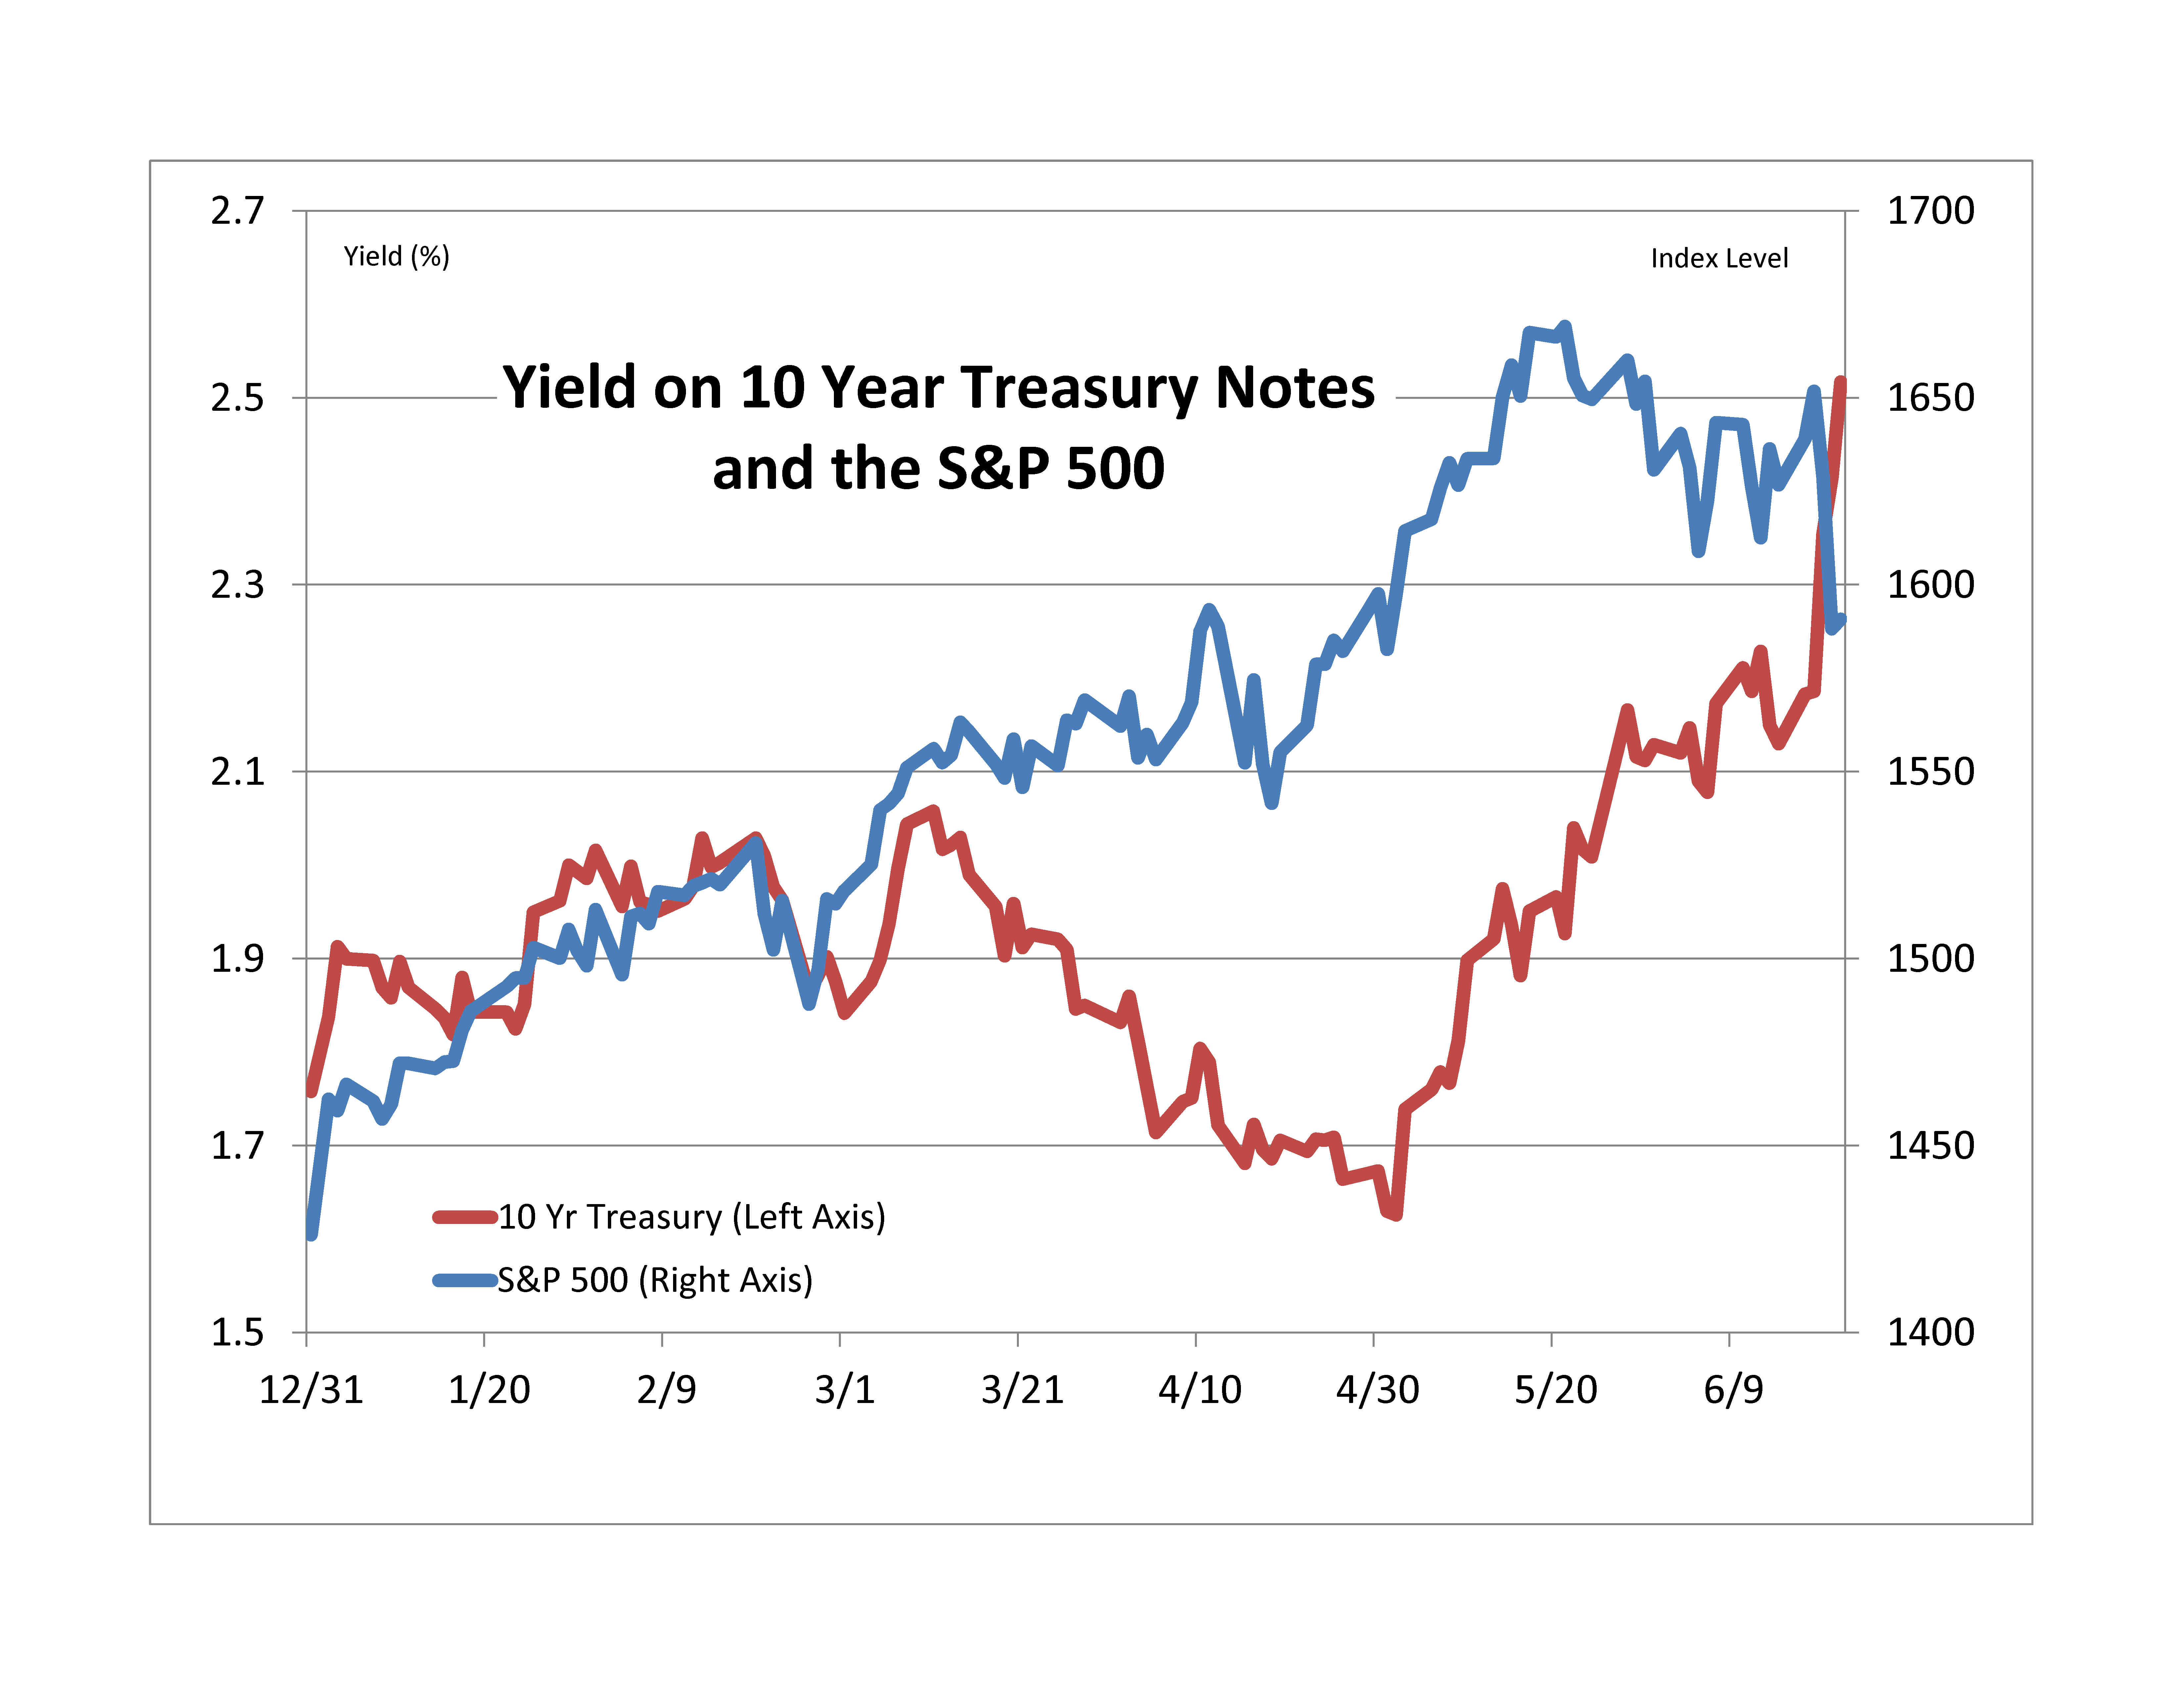
Friday afternoon and the markets survived the Fed’s pre-announcement of QE3’s demise.  The big move was in the yield on 10 year treasuries, now about 2.5%, the highest since August of 2011.  VIX broke through 20 the first time this year. The stock market is down but has only retraced its steps back to late April or early May.

Consensus outlook for the Fed is reductions in QE3 bond buying beginning in the fall and the complete end to QE3 sometime next summer.  Interest rates are expected to rise, but there is little agreement as to how much.  The Fed’s upbeat forecast for the economy of 3%-3.5% GDP growth in 2014 with continued low inflation is seen as a bit optimistic.

And now…

First, just because the Fed chairman Bernanke spent Wednesday afternoon explaining what the Fed expects and what it is likely to do, don’t believe it is locked-in or committed to a time table.  The Fed can, and frequently does, change its plans if the economy and markets change. One line many economists attribute to John Maynard Keynes is, “when the data change, I change my mind; what do you do?”  Whether or not the Fed economists are Keynesians, they do change their minds when the data change.

Second, if the Fed’s forecast turns out to be right – stronger growth, no inflation and less unemployment – the stock market’s prospects should look a whole lot better than in the last few days.  The market can advance when interest rates are rising, especially of the cause of rising rates is faster economic growth.

Third, not only is the rest of the world watching, and worrying, about the Fed; the Fed is also watching the rest of the world.  One wild card may be China where there are lots of signs that economic growth is slowing and short term interest rates spiked earlier this week.  Were Chinese economic growth to falter we would hear renewed concerns about the economy and speculation about continued quantitative easing.

Source: Data for the chart are daily data from 12/31/2012 to 6/21/2013 as of 6/21/2013. 10-year Treasury yield is from Bloomberg, S&P 500 is from S&P Dow Jones Indices. Past Performance is no guarantee of future results.

The posts on this blog are opinions, not advice. Please read our Disclaimers.

Risky Assets, Safe Havens, or Lost Identities?

Contributor Image
Jodie Gunzberg

Former Managing Director, Head of U.S. Equities

S&P Dow Jones Indices

All commodities in the S&P GSCI and the DJ-UBS CI crashed on June 20, 2013, losing 3.1% and 3.0%, respectively, after the Fed declared the U.S. economy was expanding strongly enough for the central bank to begin slowing the pace of its bond-buying stimulus later this year.  This is generally bad news for commodities since historically as the U.S dollar strengthens, goods priced in dollars become more expensive for other currencies. The historical negative relationship between the U.S. dollar and the S&P GSCI is shown below.

Source: S&P Dow Jones Indices and Bloomberg. Monthly data from 1/70 - 6/13. Charts and graphs are provided for illustrative purposes only.  Indices are unmanaged statistical composites and their returns do not include payment of any sales charges or fees an investor would pay to purchase the securities the index represents.  Such costs would lower performance.  It is not possible to invest directly in an index.  Past performance is not an indication of future results. The inception date for the S&P GSCI was May 1, 1991, at the market close.  All information presented prior to the index inception date is back-tested. There are inherent limitations associated with back-tested data.
Source: S&P Dow Jones Indices and Bloomberg. Monthly data from 1/70 – 6/13. Charts and graphs are provided for illustrative purposes only. Indices are unmanaged statistical composites and their returns do not include payment of any sales charges or fees an investor would pay to purchase the securities the index represents. Such costs would lower performance. It is not possible to invest directly in an index. Past performance is not an indication of future results. The inception date for the S&P GSCI was May 1, 1991, at the market close. All information presented prior to the index inception date is back-tested. There are inherent limitations associated with back-tested data.

In addition to the generally inverse relationship between the U.S. dollar and commodities, there may be another overbearing consequence to the quantitative easing, reducing the incentive of the risk-specialists to fill the needs of commercial hedgers.  It is based on the systematic response to whether the monetary policy works or does not work. In other words, the “Risk On – Risk Off” behavior of this market may be dominating individual commodities fundamentals, like the unexpected inventory rise of crude oil.

Thursday was a day where it seemed the “Risk-Off” was overshadowing fundamentals. The S&P GSCI and DJ-UBS CI Gold, Silver, Coffee, and Nickel, fell 6.4%, 8.3%, 4.8% and  3.5%, respectively for the day, and each are now bear markets for 2013.  The S&P GSCI Gold, which recorded its biggest daily loss ever on April 15, 2013 of -9.3%, has not had two single day losses of this magnitude in the same year since 1980.

Source: S&P Dow Jones Indices. Daily data from 1/06/78 - 6/20/13. Charts and graphs are provided for illustrative purposes only.  Indices are unmanaged statistical composites and their returns do not include payment of any sales charges or fees an investor would pay to purchase the securities the index represents.  Such costs would lower performance.  It is not possible to invest directly in an index.  Past performance is not an indication of future results. The inception date for the S&P GSCI was May 1, 1991, at the market close.  All information presented prior to the index inception date is back-tested. There are inherent limitations associated with back-tested performance.
Source: S&P Dow Jones Indices. Daily data from 1/06/78 – 6/20/13. Charts and graphs are provided for illustrative purposes only. Indices are unmanaged statistical composites and their returns do not include payment of any sales charges or fees an investor would pay to purchase the securities the index represents. Such costs would lower performance. It is not possible to invest directly in an index. Past performance is not an indication of future results. The inception date for the S&P GSCI was May 1, 1991, at the market close. All information presented prior to the index inception date is back-tested. There are inherent limitations associated with back-tested performance.


The posts on this blog are opinions, not advice. Please read our Disclaimers.

Anticipation, It's Making Me Wait

Contributor Image
Kevin Horan

Former Director, Fixed Income Indices

S&P Dow Jones Indices

And waiting is exactly what the markets did for most of Wednesday, right up until the 2 p.m. press release from the Federal Open Market Committee (FOMC) meeting. Following the press release, markets sold off on confirmation that economic activity has been expanding at a moderate pace. As the release stated, “Labor market conditions have shown further improvement in recent months, on balance, but the unemployment rate remains elevated. Household spending and business fixed investment advanced, and the housing sector has strengthened further, but fiscal policy is restraining economic growth. Partly reflecting transitory influences, inflation has been running below the Committee’s longer-run objective, but longer-term inflation expectations have remained stable.”

The selloff in the S&P 500 resulted in an immediate 10 point drop, followed by a number of attempts to recover, finally ending the day down 22.88 at 1628.93. Bond prices also fell as the yield on the 10-year Treasury rose 8 basis points (bps) on the news. The previous day’s 2.18% close was quickly eclipsed as the 10-year note finished the day at 2.35%. The S&P/BGCantor 10-20 Year U.S. Treasury Bond Index gave up 1.20% and is now down 4.24% on the year. The importance of an index like the 10-20 year index, with 10.07 years of duration, is that it’s an indicator for mortgage rates, which are benchmarked to the 10-year Treasury.

The FOMC decided to keep the target range for the federal funds rate at 0%-0.25%, and to continue purchasing agency mortgage-backed securities at a pace of $40 billion per month and longer-term Treasury securities at a pace of $45 billion per month. The Fed’s previously stated plan was to continue the stimulus as long as the unemployment rate remained above 6.5%, with an inflation goal of 2%. Today’s press conference hinted that a 7% unemployment rate would be an acceptable level to start curtailing quantitative easing. Hints of a possible early start to tapering took its toll on the credit markets as well. The S&P U.S. Issued Investment Grade Corporate Bond Index was down 0.72% for the day, led by the Atmos Energy Corp. 4.15% January 2043 bond, whose daily total return was -0.03%. High-yield bonds did not sell off quite as much, as the shorter duration (4.97 years) index dropped by only -0.09% for the day as measured by the S&P U.S. Issued High Yield Corporate Bond Index.

The S&P/LSTA U.S. Leveraged Loan 100 Index was unchanged for the day and is down -0.26% month-to-date. When comparing the returns of both high yield bonds and senior loans, the performance of senior loans has better weathered the current volatility in interest rates.

Fixed Income down after the FOMC meeting announcement.

The posts on this blog are opinions, not advice. Please read our Disclaimers.

Who's complaining, who's speculating, who's hedging and who's to blame?

Contributor Image
Jodie Gunzberg

Former Managing Director, Head of U.S. Equities

S&P Dow Jones Indices

JOIN US FOR OUR 7TH ANNUAL COMMODITIES SEMINAR!

Managing Commodities in Modern Times:
Hard-Won Lessons After 160 Years of Trial & Error

S&P Dow Jones Indices invites you to this half-day complimentary seminar which has become Europe’s annual meeting point for commodity aficionados for close to a decade.

Join us and other leading industry professionals for an afternoon of education and networking opportunities. Take a front row seat to walk away with valuable insights into current trends and issues under the umbrella of who’s complaining, who’s hedging, who’s speculating, who’s to blame and finally, where do I go?

Keynote Speaker: Hilary Till, Research Associate, EDHEC-Risk Institute, Principal, Premia Capital Management LLC., Co-Editor, Intelligent Commodity Investing

Our speakers will examine:

What causes spikes in commodity prices and how regulation is impacting commodity investment in modern market times


  • Perspectives on what the speculators are doing versus who are the hedgers, and why the lines might not be so clear
  • What incidental factors are tipping the market and the limitations for producers and consumers?
  • What’s driving the world’s demand economy today and where it might be heading
  • The latest techniques in managing commodity exposures in potentially uncertain times


The posts on this blog are opinions, not advice. Please read our Disclaimers.

S&P Dow Jones Raises Market Cap Guidelines for S&P 500

Contributor Image
David Blitzer

Former Managing Director and Chairman of the Index Committee

S&P Dow Jones Indices

In a release on June 19th the S&P Dow Jones US Index Committee raised the market cap guidelines used when selecting companies for the S&P 500, S&P  Mid Cap 400 and S&P Small Cap 600. The new guidelines are:

  • S&P 500: Over $4.6 billion, raised from $4 billion
  • S&P Mid Cap 400: $1.2 to $5.1 billion, raised from $1 to $4.4 billion
  • S&P SmallCap 600: $350 million to $1.6 Billion, raised from $300 million to $1.4 billion

The changes reflect the market’s movement since the bottom in March 2009 and especially in the last two years of gains.  The last increase was almost two and a half years ago in February, 2011.   Given the recent gains, what makes a company an S&P 500 Company is a somewhat bigger hurdle than it was two years ago.  The Index Committee monitors market developments as well as events affecting the indices. The guidelines help determine which index a company should be added to.  Market cap is not the only factor affecting the selection of companies for the S&P 500 and our other indices.  Other criteria include what sector the company is in, its liquidity and financial viability and that it must be a U.S. company.

The posts on this blog are opinions, not advice. Please read our Disclaimers.